The Netavis Multi-Sensor Platform

1
2
3
4
5
6
7
8
9
10
11
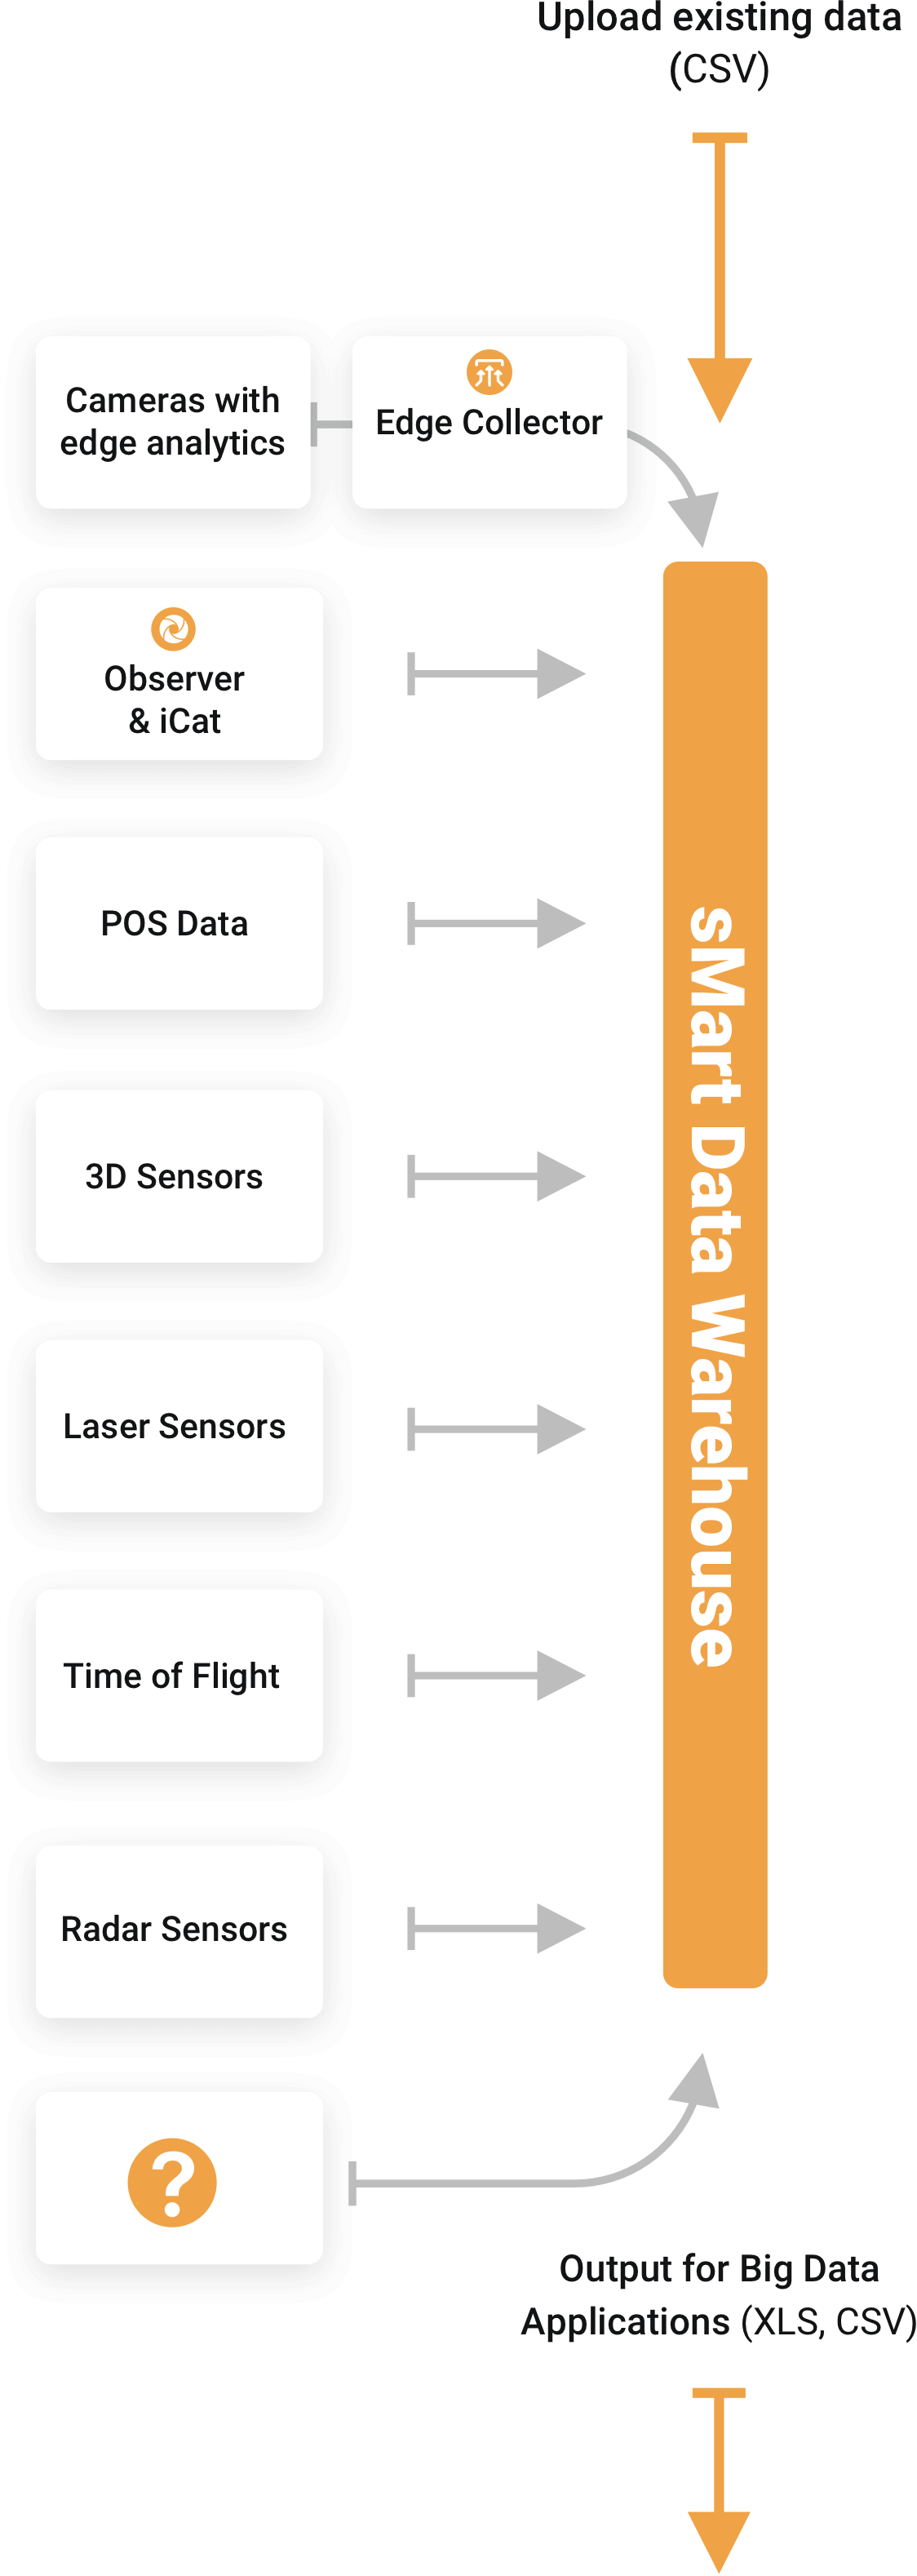
Infographic of the Netavis Multi-Sensor Platform with sMart collecting data from various sensors and owned and third party systems
1

e.g. counting data from existing sensors

2

Data collector for edge analytics devices

3

Video analytics data generated directly at the edge

4

Server-based video analytics data

5

Business data collected from POS Systems

6

Highly accurate counting statistics

7

For a reliable detection of objects without being subject to any privacy-related restrictions

8

For reliable detection of objects without being subject to any privacy-related restrictions and the option to exclude staff

9

For reliable detection of objects without being subject to any privacy-related restrictions

10

Future technologies

11

Prepare and export collected data for big data applications

Infographic of the Netavis Multi-Sensor Platform with sMart collecting data from various sensors and owned and third party systems

Upload existing data (CSV):

e.g. counting data from existing sensors

Edge Collector:

Data collector for edge analytics devices

Cameras with Edge Analyse:

Video analytics data generated directly at the edge

Observer & iCat:

Server-based video analytics data

POS Data:

Business data collected from POS Systems

3D Sensors:

Highly accurate counting statistics

Laser Sensors:

For a reliable detection of objects without being subject to any privacy-related restrictions

Time of Flight Sensors:

For reliable detection of objects without being subject to any privacy-related restrictions and the option to exclude staff

Radar Sensors:

For reliable detection of objects without being subject to any privacy-related restrictions

Future technologies

Output for Big Data Applications (XLS, CSV):

Prepare and export collected data for Big Data Applications

Business Data Analytics

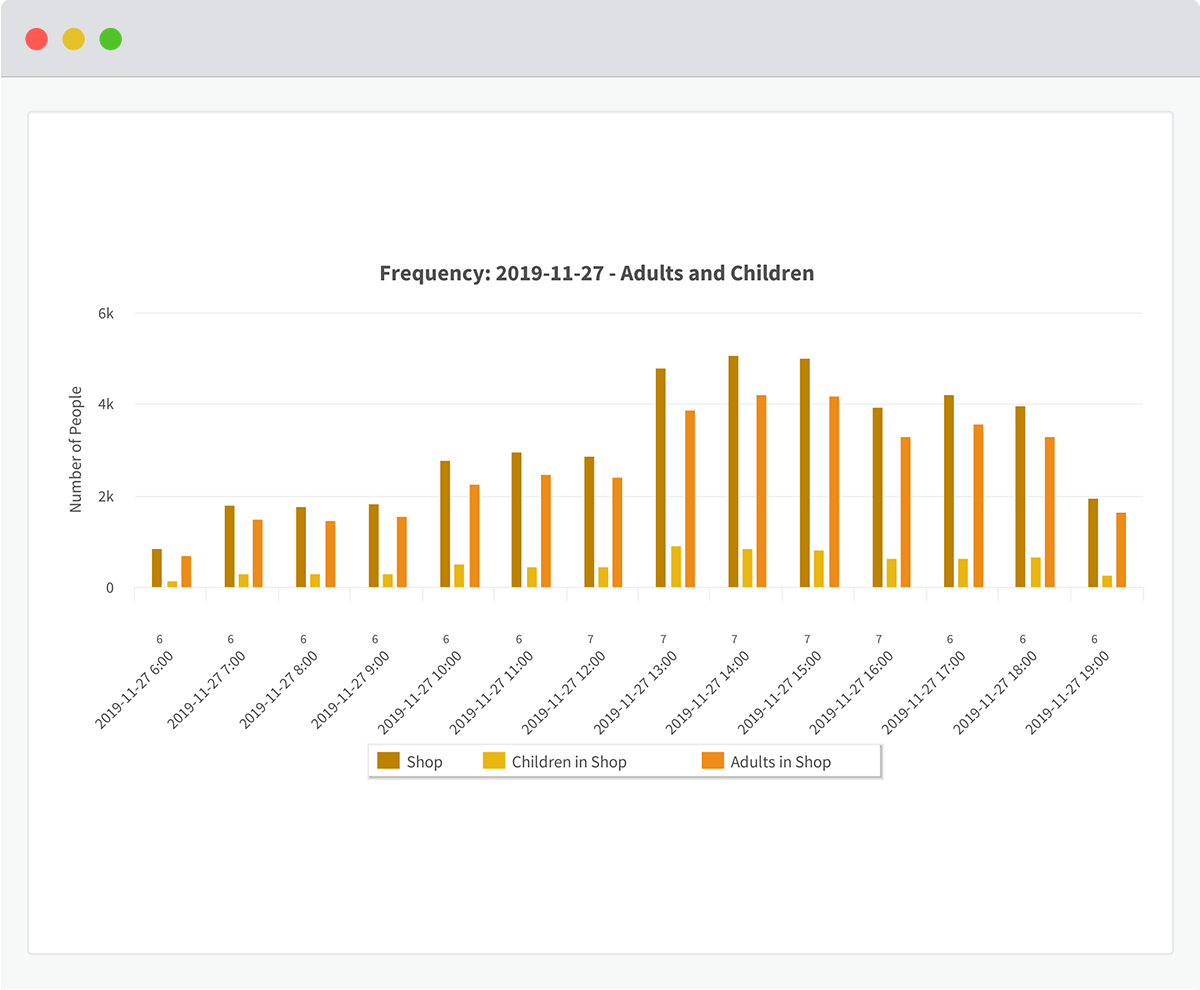
Customer Frequency

Turn-In-Rate

Conversion Rate

Segmentation of Children & Adults

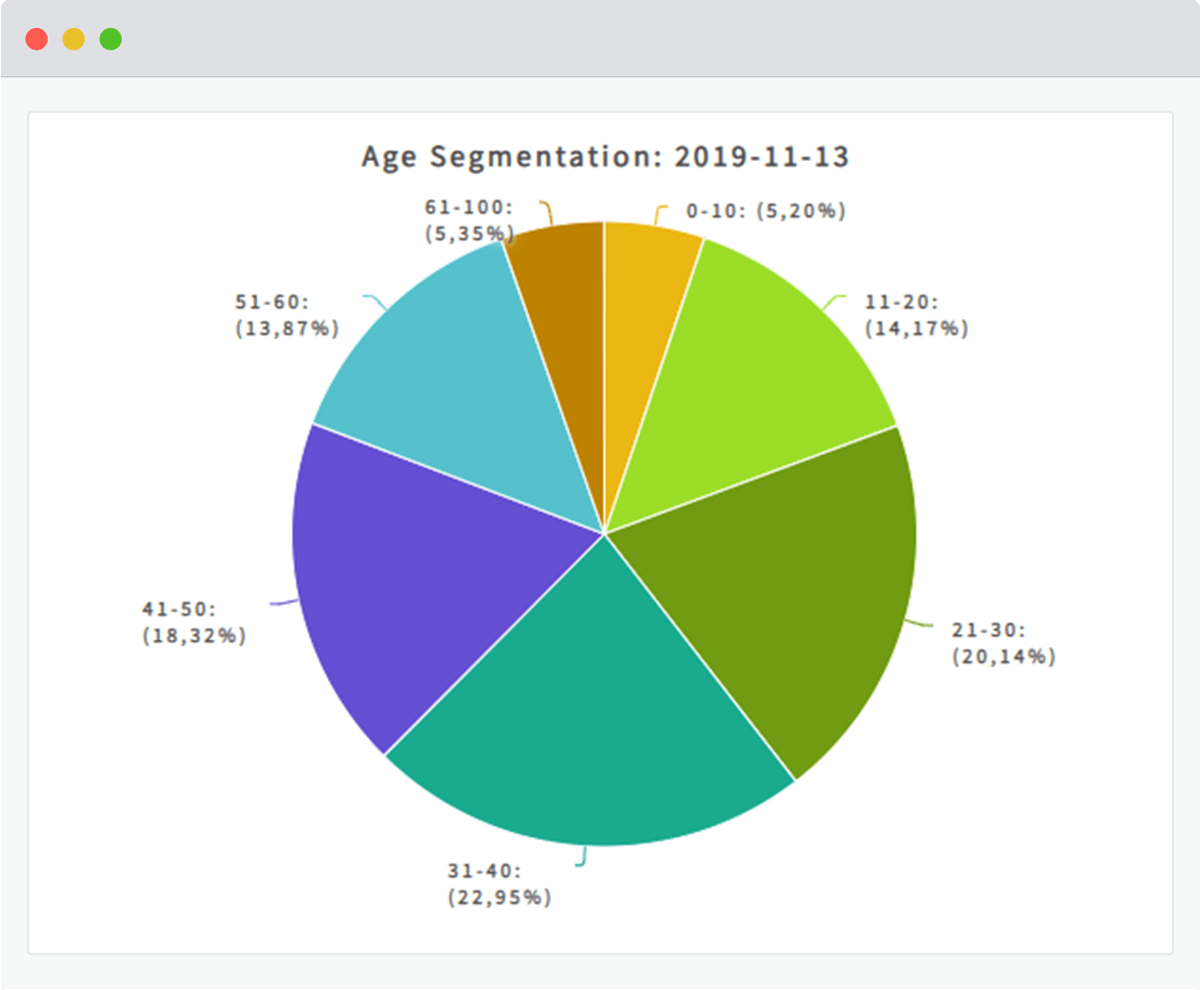
Age Segmentation

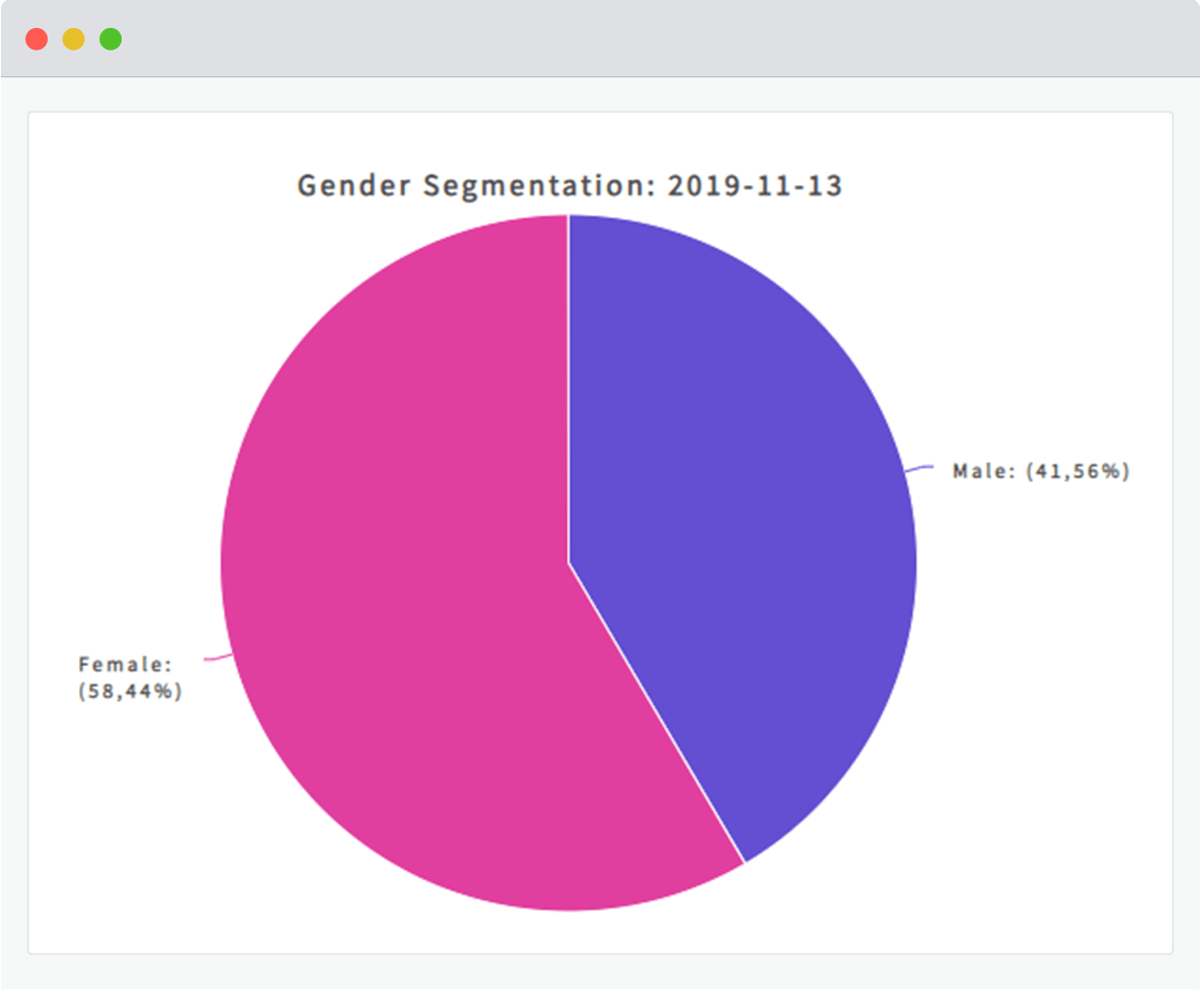
Gender Segmentation

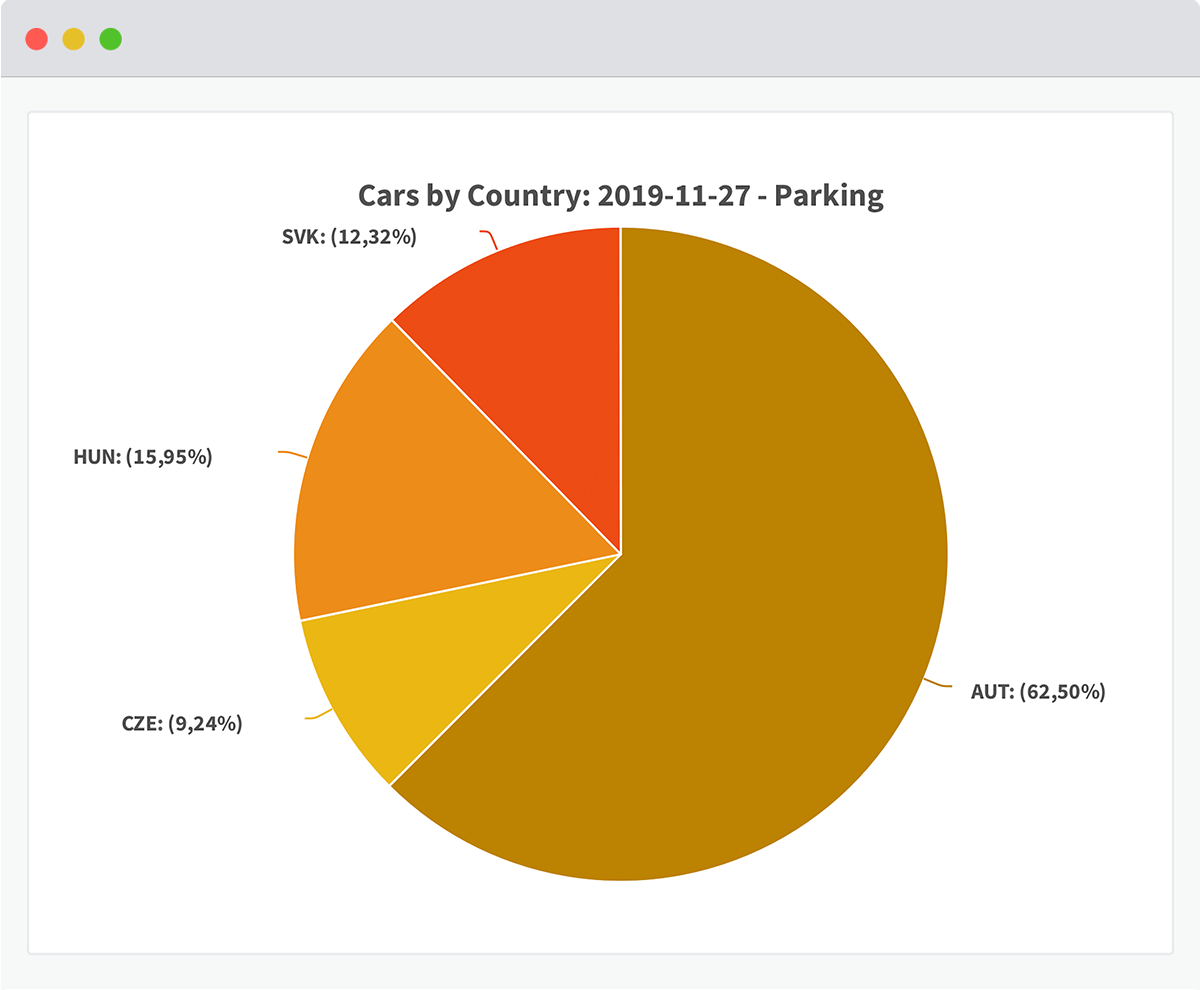
Geographic Segmentation

Heat Maps

Attention Time

Customer Dwell Time

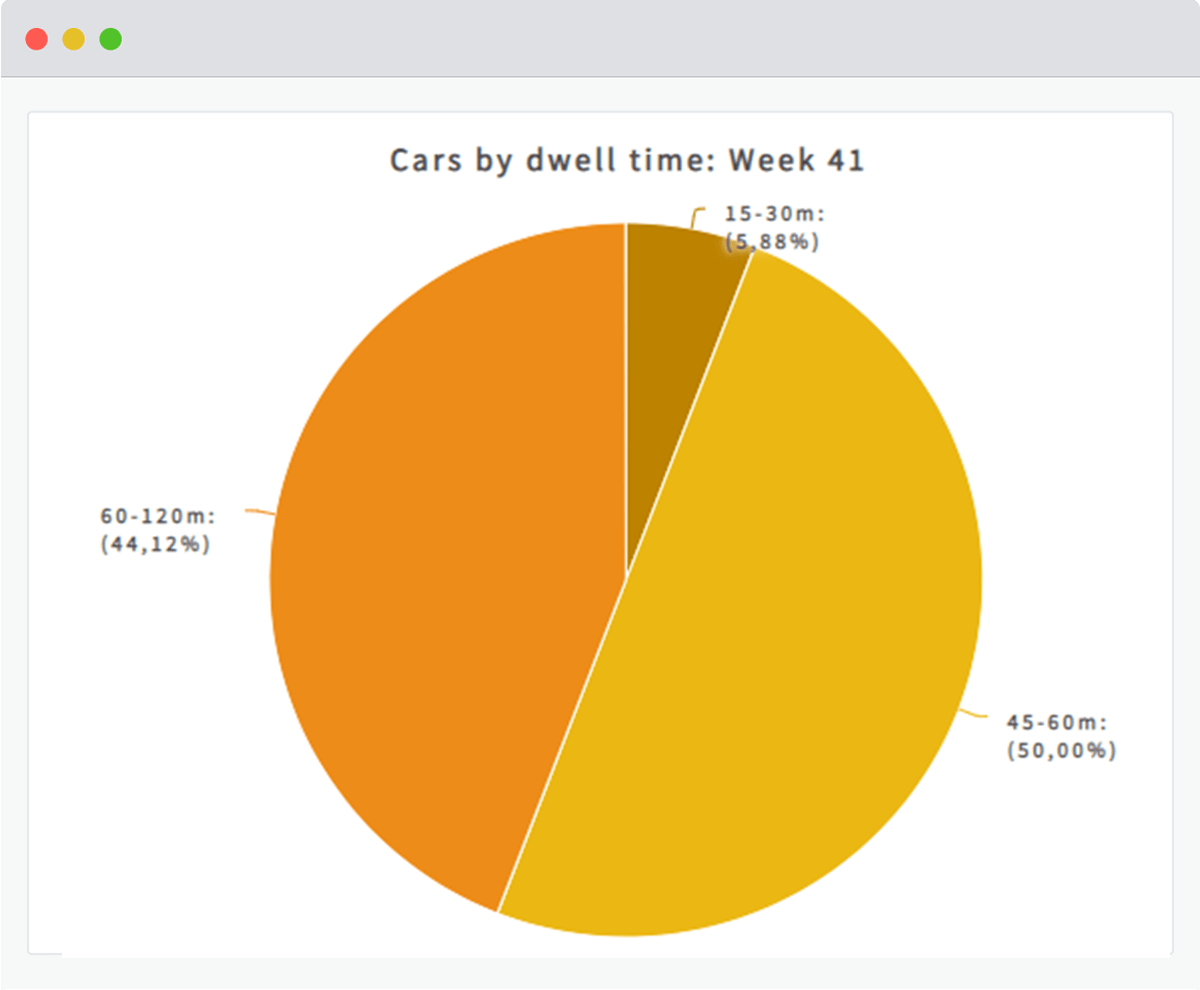
Cars by Dwell Time

Customer Frequency

Turn-In-Rate

Conversion Rate

Segmentation of Children & Adults

Age Segmentation

Gender Segmentation

Geographic Segmentation

Heat Maps

Attention Time

Customer Dwell Time

Cars by Dwell Time

Custom Dashboards

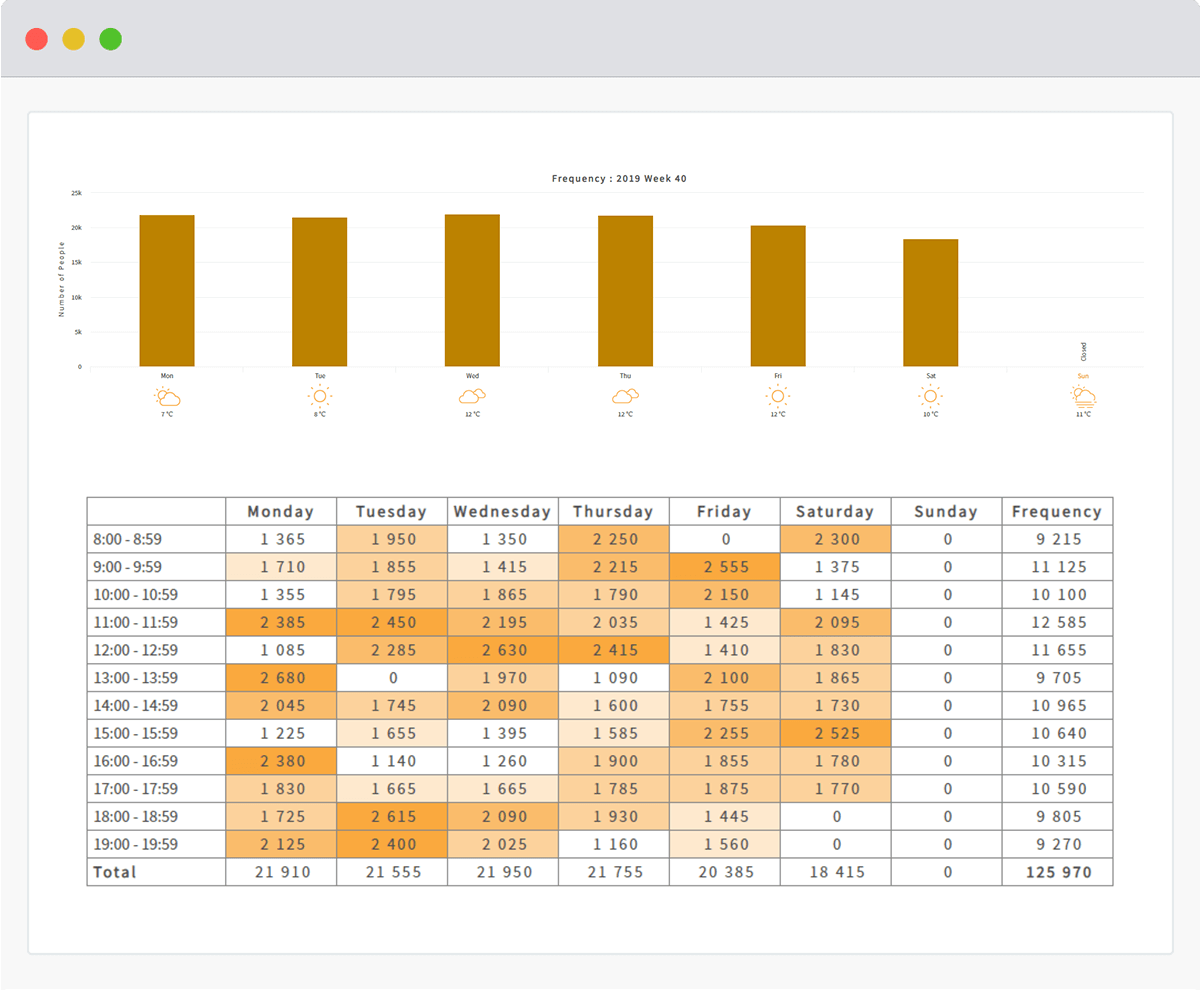
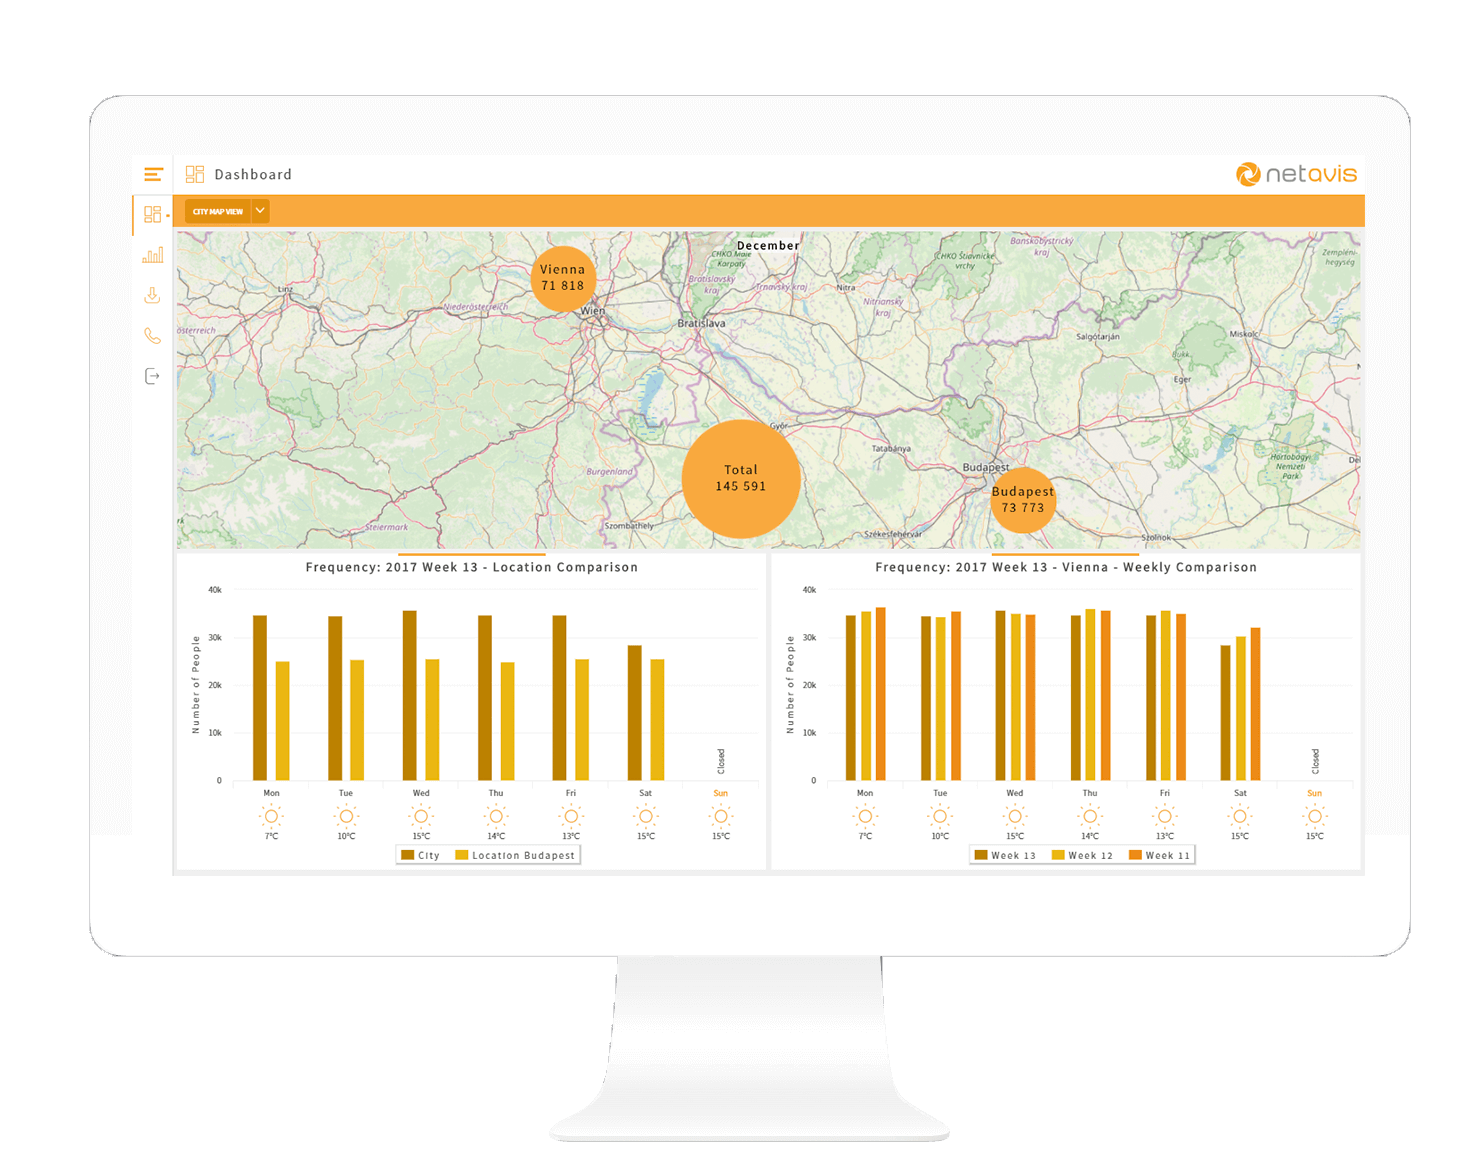
Dashboards are the primary access to data in sMart and show the most important information at a glance. Through individual customization options, each user can select the information relevant to him. Different layouts allow the intuitive presentation of maps, images and heat maps. Configurable diagrams illustrate complex data sets and comparisons of time periods or stores for metrics such as customer frequency, customer behavior analysis or customer segmentation. Information such as weather data can also be included.

Automated reports

All data collected in sMart can be compiled in password-protected PDF reports and sent regularly (daily, weekly or monthly) as an e-mail to predefined recipients. The reports are tailored to the individual user and can be used to compare all system data over time (for example: current month compared to last month) or between different locations.

Data analysis tool

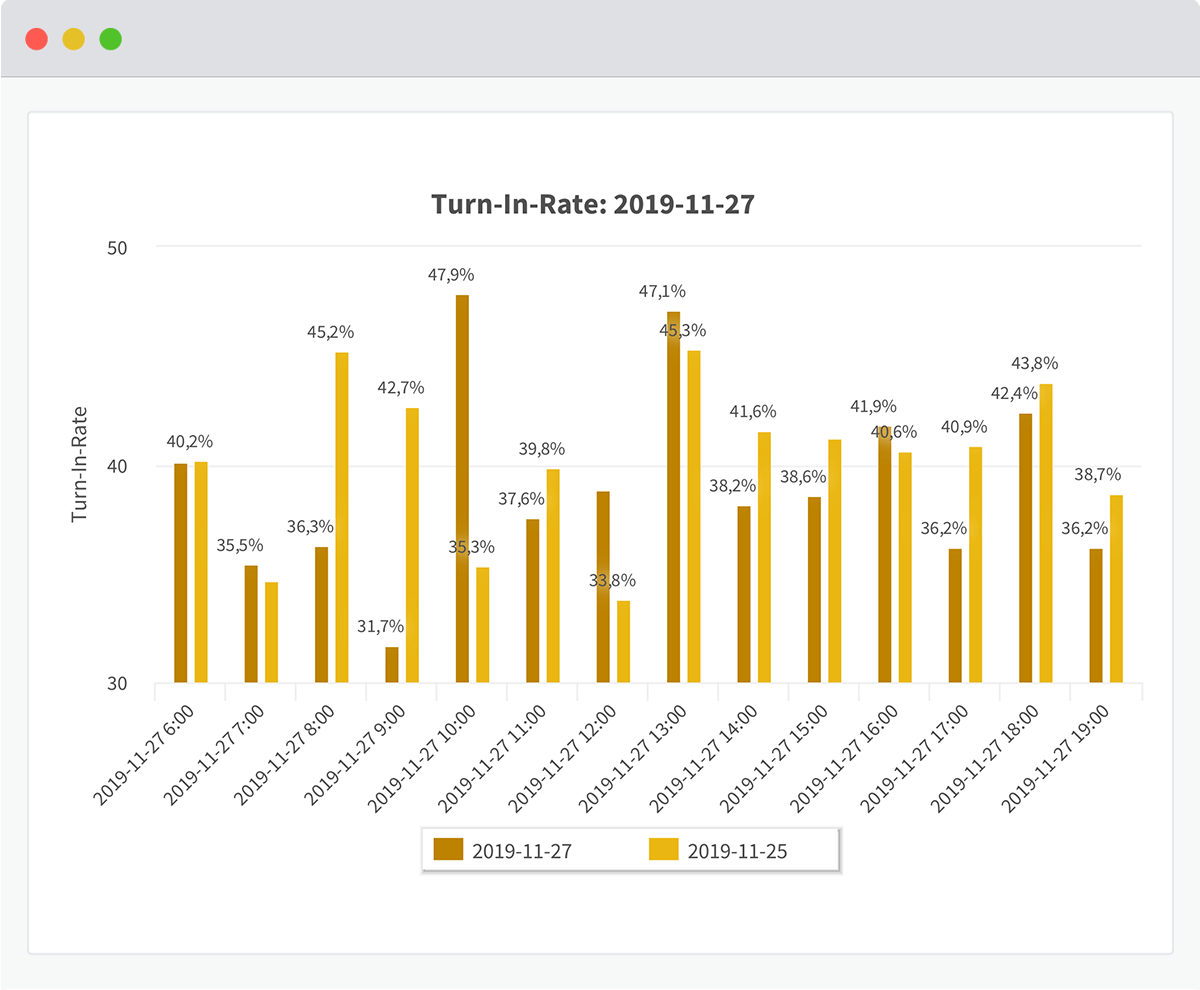
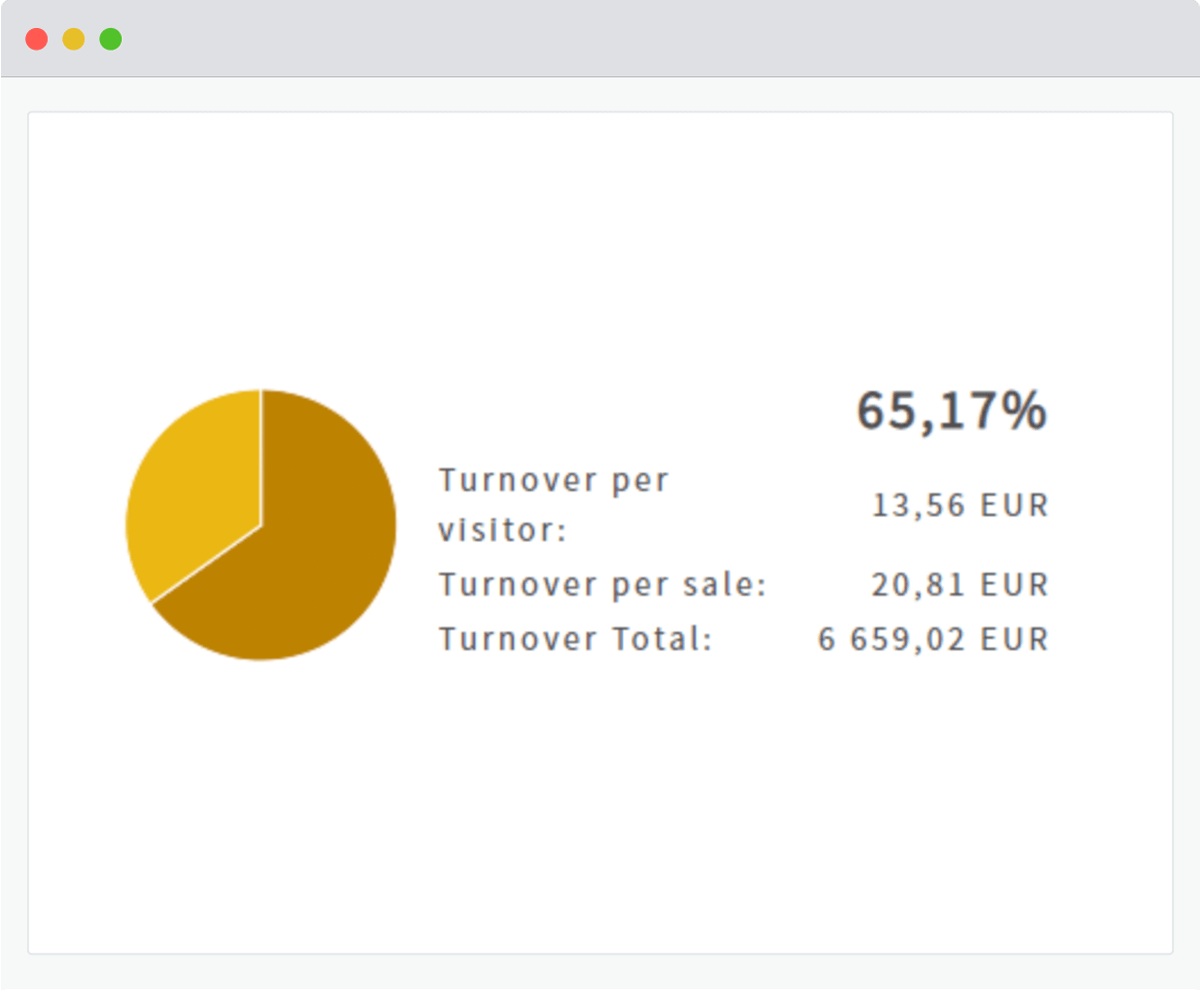
The sMart data analysis provides a detailed insight into all data stored in sMart. Information about customer frequency, customer segmentation and customer behaviour can be compared over specific time periods or between locations and detailed data analysis can be performed. sMart thereby provides detailed insights into turn in rates and other business topics to empower retail executives to make the best choices for improved increased staff planning efficiency, store layout optimizations and customer service improvements. 

Custom Dashboards

Dashboards are the primary access to data in sMart and show the most important information at a glance. Through individual customization options, each user can select the information relevant to him. Different layouts allow the intuitive presentation of maps, images and heat maps. Configurable diagrams illustrate complex data sets and comparisons of time periods or stores for metrics such as customer frequency, customer behavior analysis or customer segmentation. Information such as weather data can also be included.

Automated reports

All data collected in sMart can be compiled in password-protected PDF reports and sent regularly (daily, weekly or monthly) as an e-mail to predefined recipients. The reports are tailored to the individual user and can be used to compare all system data over time (for example: current month compared to last month) or between different locations.

Data analysis tool

The sMart data analysis provides a detailed insight into all data stored in sMart. Information about customer frequency, customer segmentation and customer behaviour can be compared over specific time periods or between locations and detailed data analysis can be performed. sMart thereby provides detailed insights into turn in rates and other business topics to empower retail executives to make the best choices for improved increased staff planning efficiency, store layout optimizations and customer service improvements.

Privacy

By separating video streams and business data, video analysis without personalization and selecting suitable sensors, our solutions are not subject to any privacy-related restrictions.

Deployment Options

On Premise

Installed on your own  IT infrastructure
Keep full control of confidential data
free choice of hardware

In the Cloud as SaaS

The system is hosted in the cloud:
Ready for immediate use
Monthly billing without hardware costs
Fast and mobile access to information

Netavis Linse

Netavis Retail solutions

sMart Demo

See what data you can get by using the Netavis solution

Click „Start Demo“

Input Username and Password

Log In

Get started today!

Stay in touch!

Join our mailing list.

*Netavis Software GmbH will use the information you provide on this form to be in touch with you and to provide you with marketing updates.

All business data in one place:
Collect, manage and analyze

sMart Data Warehouse

Contact us Das smart datawarehouse dashboard mit city map view zum vergleiche mehrerer filialen sMart is the heart of our multi-sensor platform. It collects and manages data from various sensors and systems. By transforming the data into key performance indicators, the data is made analyzable. Each user gets at a glance the most important information and can quickly make informed decisions. To perform a deeper business analysis, all data can be compared and further analyzed. Furthermore, sMart offers output for big data applications. Versatile customization options and fast customization make the platform flexible. Hintergrundbild main page setREVStartSize({c: 'rev_slider_14_1',rl:[1240,1240,1240,480],el:[550,550,550,720],gw:[1240,1240,1240,480],gh:[550,550,550,720],layout:'fullwidth',mh:"0"}); var revapi14, tpj; jQuery(function() { tpj = jQuery; if(tpj("#rev_slider_14_1").revolution == undefined){ revslider_showDoubleJqueryError("#rev_slider_14_1"); }else{ revapi14 = tpj("#rev_slider_14_1").show().revolution({ jsFileLocation:"//www.netavis.net/wp-content/plugins/revslider/public/assets/js/", duration:"4000ms", visibilityLevels:"1240,1240,1240,480", gridwidth:"1240,1240,1240,480", gridheight:"550,550,550,720", minHeight:"", spinner:"spinner0", editorheight:"550,768,960,720", responsiveLevels:"1240,1240,1240,480", disableProgressBar:"on", navigation: { onHoverStop:false }, fallbacks: { allowHTML5AutoPlayOnAndroid:true }, }); } });
The Netavis Multi-Sensor Platform

1
2
3
4
5
6
7
8
9
10
11
Infographic of the Netavis Multi-Sensor Platform with sMart collecting data from various sensors and owned and third party systems
1

e.g. counting data from existing sensors

2

Data collector for edge analytics devices

3

Video analytics data generated directly at the edge

4

Server-based video analytics data

5

Business data collected from POS Systems

6

Highly accurate counting statistics

7

For a reliable detection of objects without being subject to any privacy-related restrictions

8

For reliable detection of objects without being subject to any privacy-related restrictions and the option to exclude staff

9

For reliable detection of objects without being subject to any privacy-related restrictions

10

Future technologies

11

Prepare and export collected data for big data applications

Infographic of the Netavis Multi-Sensor Platform with sMart collecting data from various sensors and owned and third party systems

Upload existing data (CSV):

e.g. counting data from existing sensors

Edge Collector:

Data collector for edge analytics devices

Cameras with Edge Analyse:

Video analytics data generated directly at the edge

Observer & iCat:

Server-based video analytics data

POS Data:

Business data collected from POS Systems

3D Sensors:

Highly accurate counting statistics

Laser Sensors:

For a reliable detection of objects without being subject to any privacy-related restrictions

Time of Flight Sensors:

For reliable detection of objects without being subject to any privacy-related restrictions and the option to exclude staff

Radar Sensors:

For reliable detection of objects without being subject to any privacy-related restrictions

Future technologies

Output for Big Data Applications (XLS, CSV):

Prepare and export collected data for Big Data Applications

Business Data Analytics

Customer Frequency

Turn-In-Rate

Conversion Rate

Segmentation of Children & Adults

Age Segmentation

Gender Segmentation

Geographic Segmentation

Heat Maps

Attention Time

Customer Dwell Time

Cars by Dwell Time

Customer Frequency

Turn-In-Rate

Conversion Rate

Segmentation of Children & Adults

Age Segmentation

Gender Segmentation

Geographic Segmentation

Heat Maps

Attention Time

Customer Dwell Time

Cars by Dwell Time

Custom Dashboards

Dashboards are the primary access to data in sMart and show the most important information at a glance. Through individual customization options, each user can select the information relevant to him. Different layouts allow the intuitive presentation of maps, images and heat maps. Configurable diagrams illustrate complex data sets and comparisons of time periods or stores for metrics such as customer frequency, customer behavior analysis or customer segmentation. Information such as weather data can also be included.

Automated reports

All data collected in sMart can be compiled in password-protected PDF reports and sent regularly (daily, weekly or monthly) as an e-mail to predefined recipients. The reports are tailored to the individual user and can be used to compare all system data over time (for example: current month compared to last month) or between different locations.

Data analysis tool

The sMart data analysis provides a detailed insight into all data stored in sMart. Information about customer frequency, customer segmentation and customer behaviour can be compared over specific time periods or between locations and detailed data analysis can be performed. sMart thereby provides detailed insights into turn in rates and other business topics to empower retail executives to make the best choices for improved increased staff planning efficiency, store layout optimizations and customer service improvements. 

Custom Dashboards

Dashboards are the primary access to data in sMart and show the most important information at a glance. Through individual customization options, each user can select the information relevant to him. Different layouts allow the intuitive presentation of maps, images and heat maps. Configurable diagrams illustrate complex data sets and comparisons of time periods or stores for metrics such as customer frequency, customer behavior analysis or customer segmentation. Information such as weather data can also be included.

Automated reports

All data collected in sMart can be compiled in password-protected PDF reports and sent regularly (daily, weekly or monthly) as an e-mail to predefined recipients. The reports are tailored to the individual user and can be used to compare all system data over time (for example: current month compared to last month) or between different locations.

Data analysis tool

The sMart data analysis provides a detailed insight into all data stored in sMart. Information about customer frequency, customer segmentation and customer behaviour can be compared over specific time periods or between locations and detailed data analysis can be performed. sMart thereby provides detailed insights into turn in rates and other business topics to empower retail executives to make the best choices for improved increased staff planning efficiency, store layout optimizations and customer service improvements.

Privacy

By separating video streams and business data, video analysis without personalization and selecting suitable sensors, our solutions are not subject to any privacy-related restrictions.

Deployment Options

On Premise

Installed on your own  IT infrastructure
Keep full control of confidential data
free choice of hardware

In the Cloud as SaaS

The system is hosted in the cloud:
Ready for immediate use
Monthly billing without hardware costs
Fast and mobile access to information

Netavis Linse

Netavis Retail solutions

sMart Demo

See what data you can get by using the Netavis solution

Click „Start Demo“

Input Username and Password

Log In

Get started today!

Stay in touch!

Join our mailing list.

*Netavis Software GmbH will use the information you provide on this form to be in touch with you and to provide you with marketing updates.

Netavis